Know Portfolio RISK –
Evaluate Manager SKILL
Risk
Skill
Fund Screener
Fund Screener screens RISK and SKILL metrics
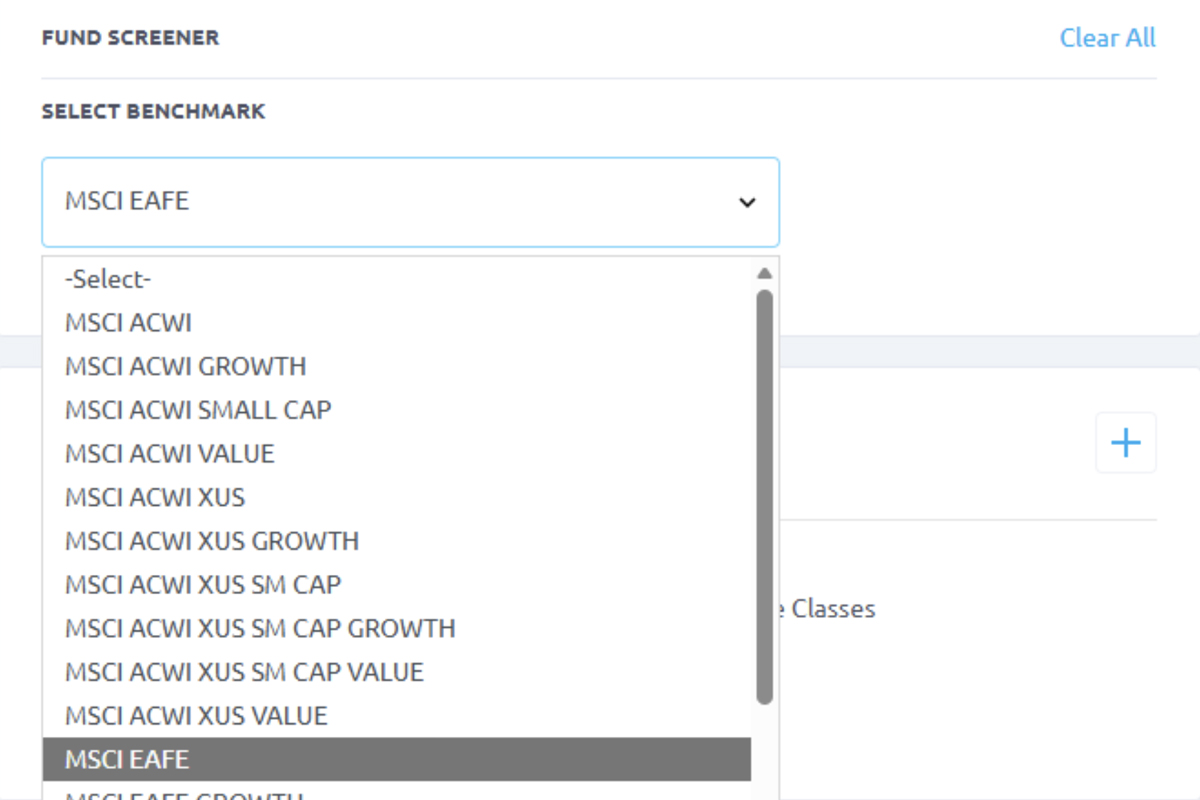
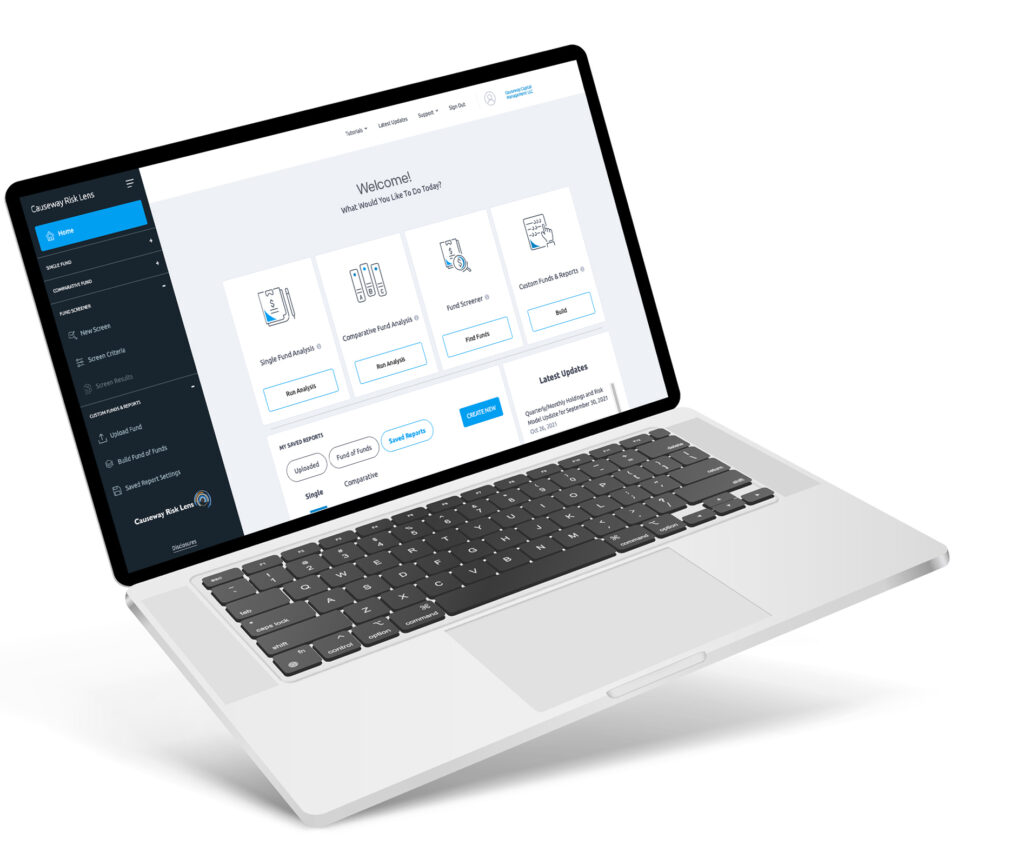
Pick A Benchmark –
Choose from 37 benchmarks across all major geographies
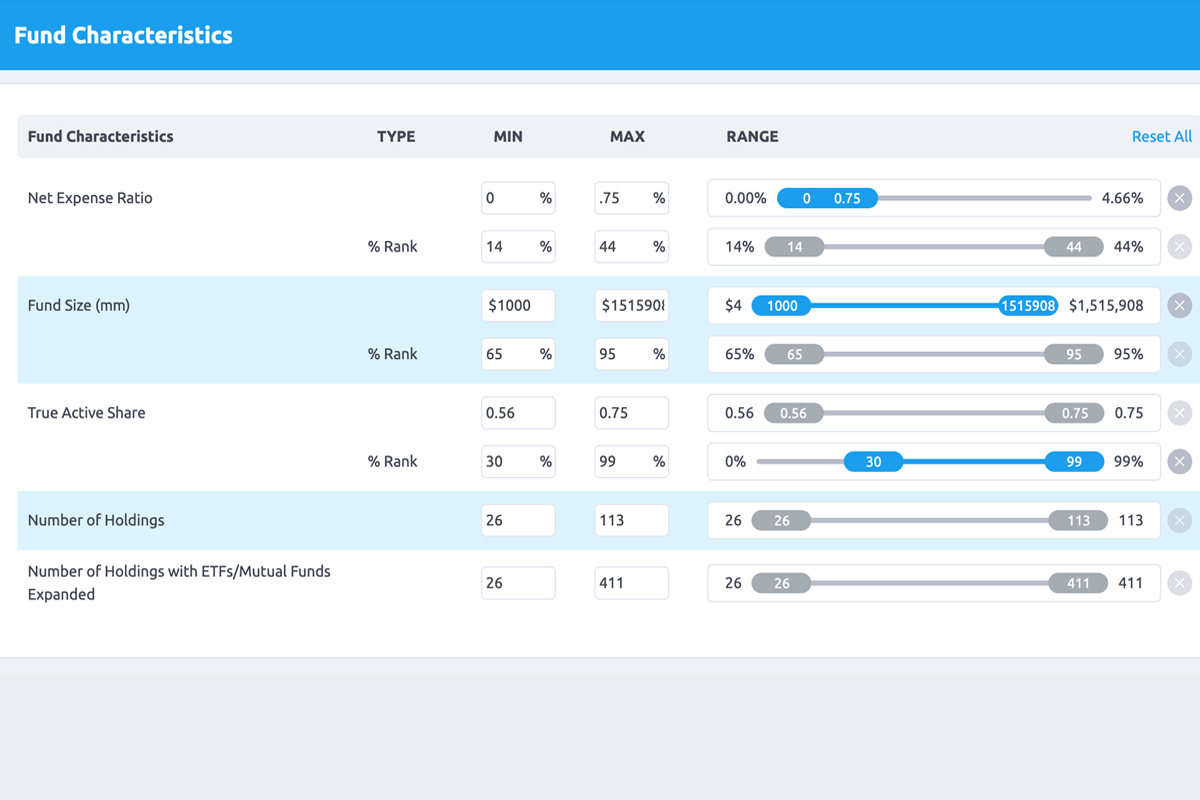
Select Your Screens –
Filter on both risk exposures and skill metrics
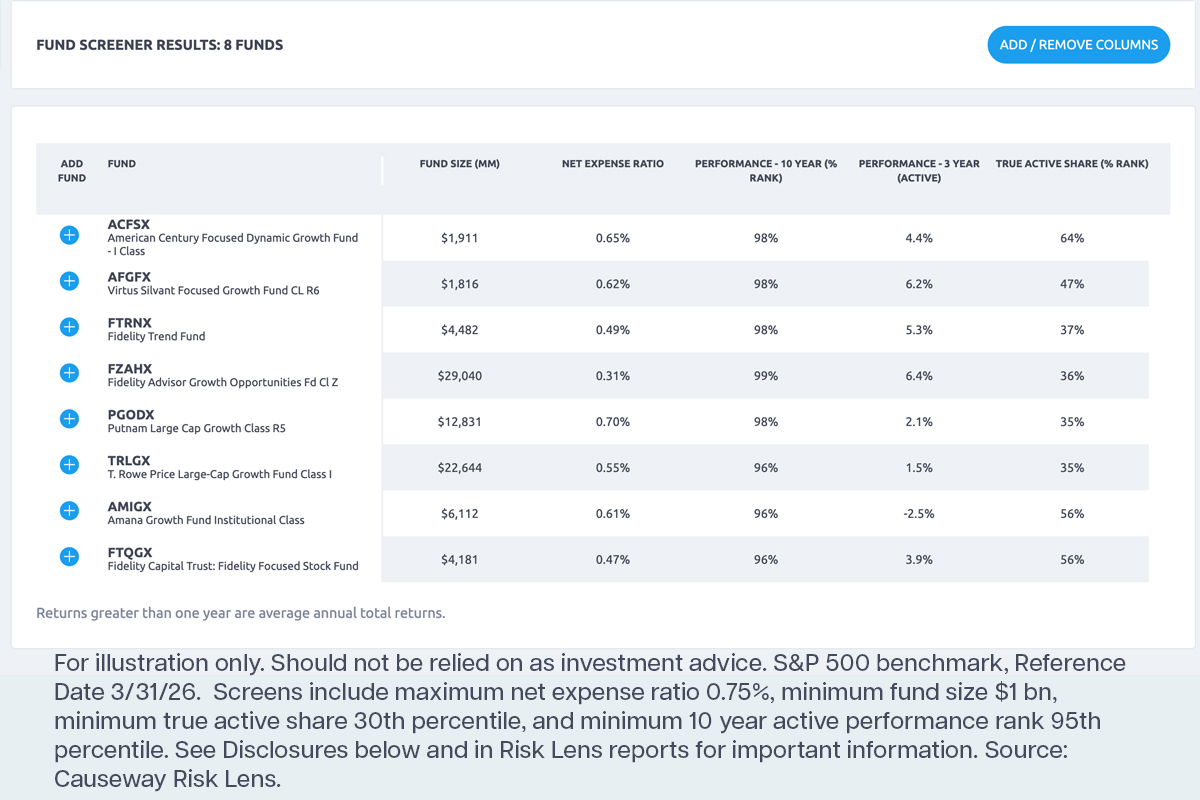
Find Your Funds –
Find managers that meet your criteria
Why Risk Lens?
RISK
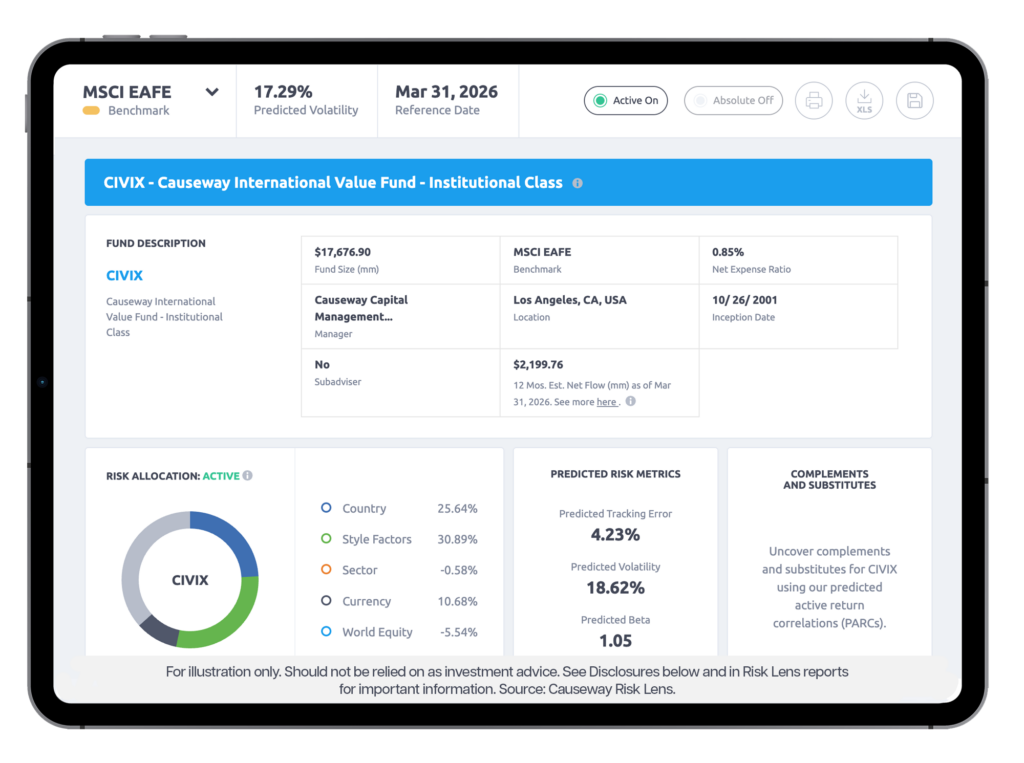
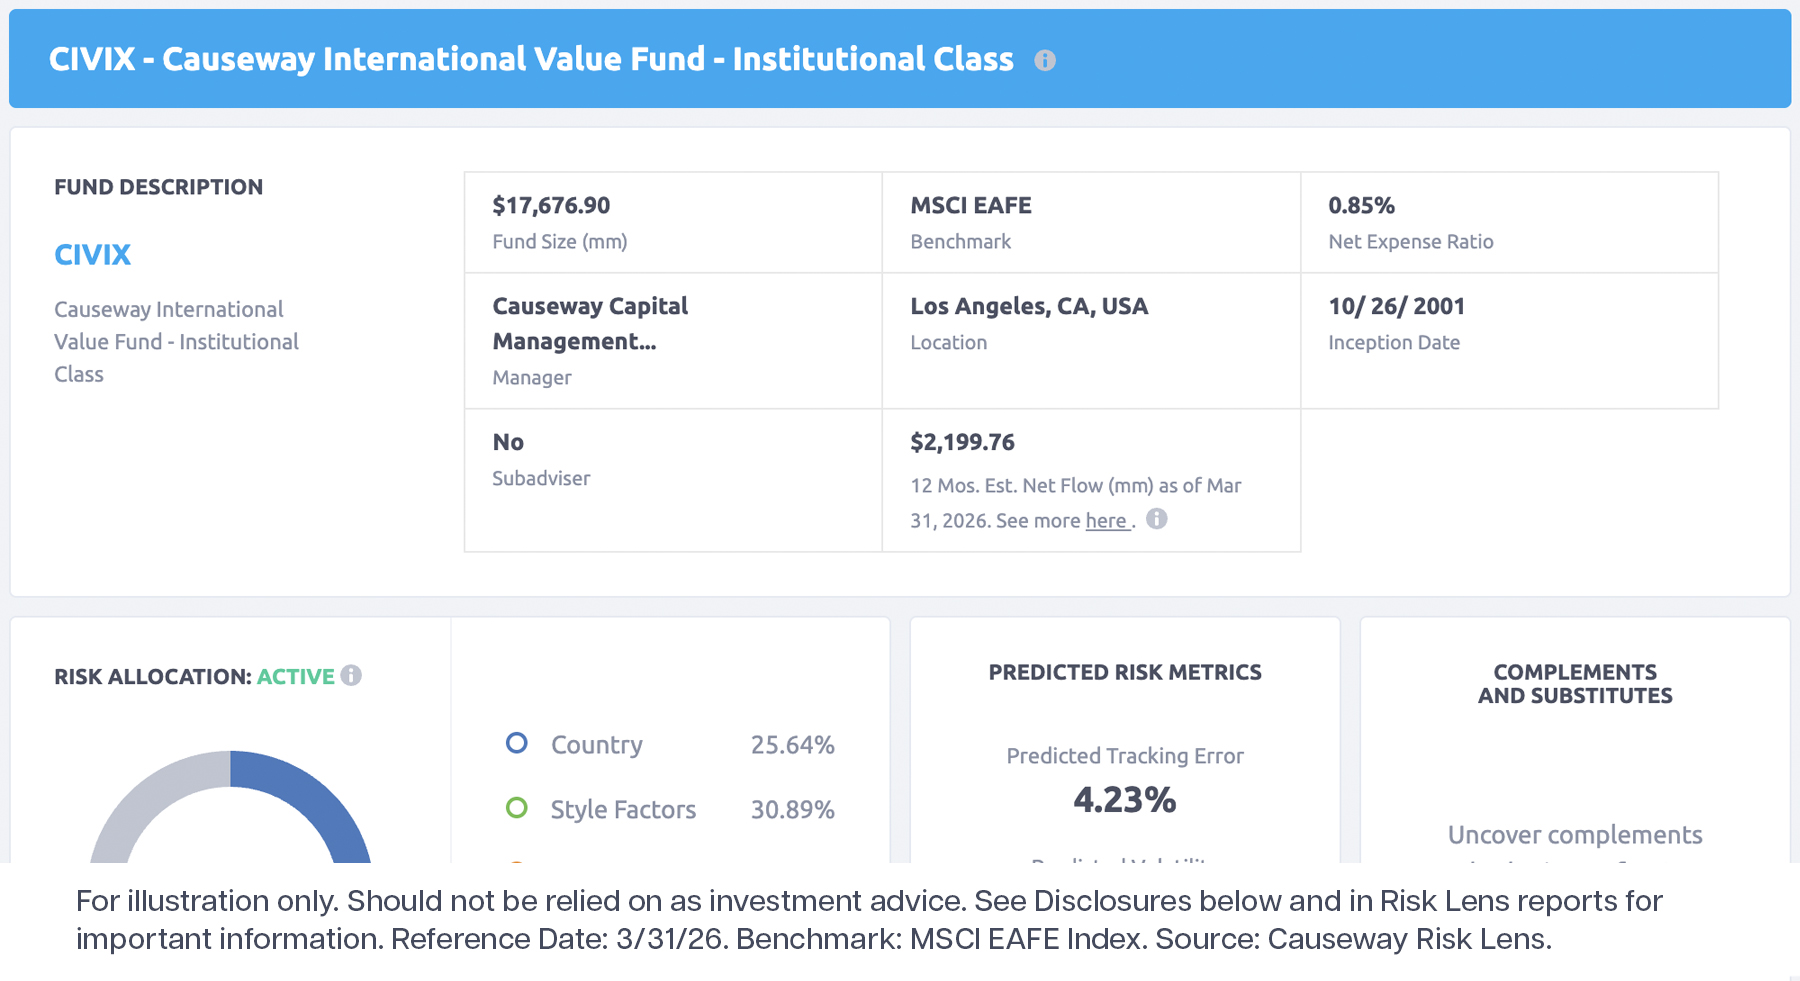
Holdings-based – we estimate predicted risks and correlations using the latest available public fund holdings. Many other tools are returns-based, only showing past risk metrics.
SKILL
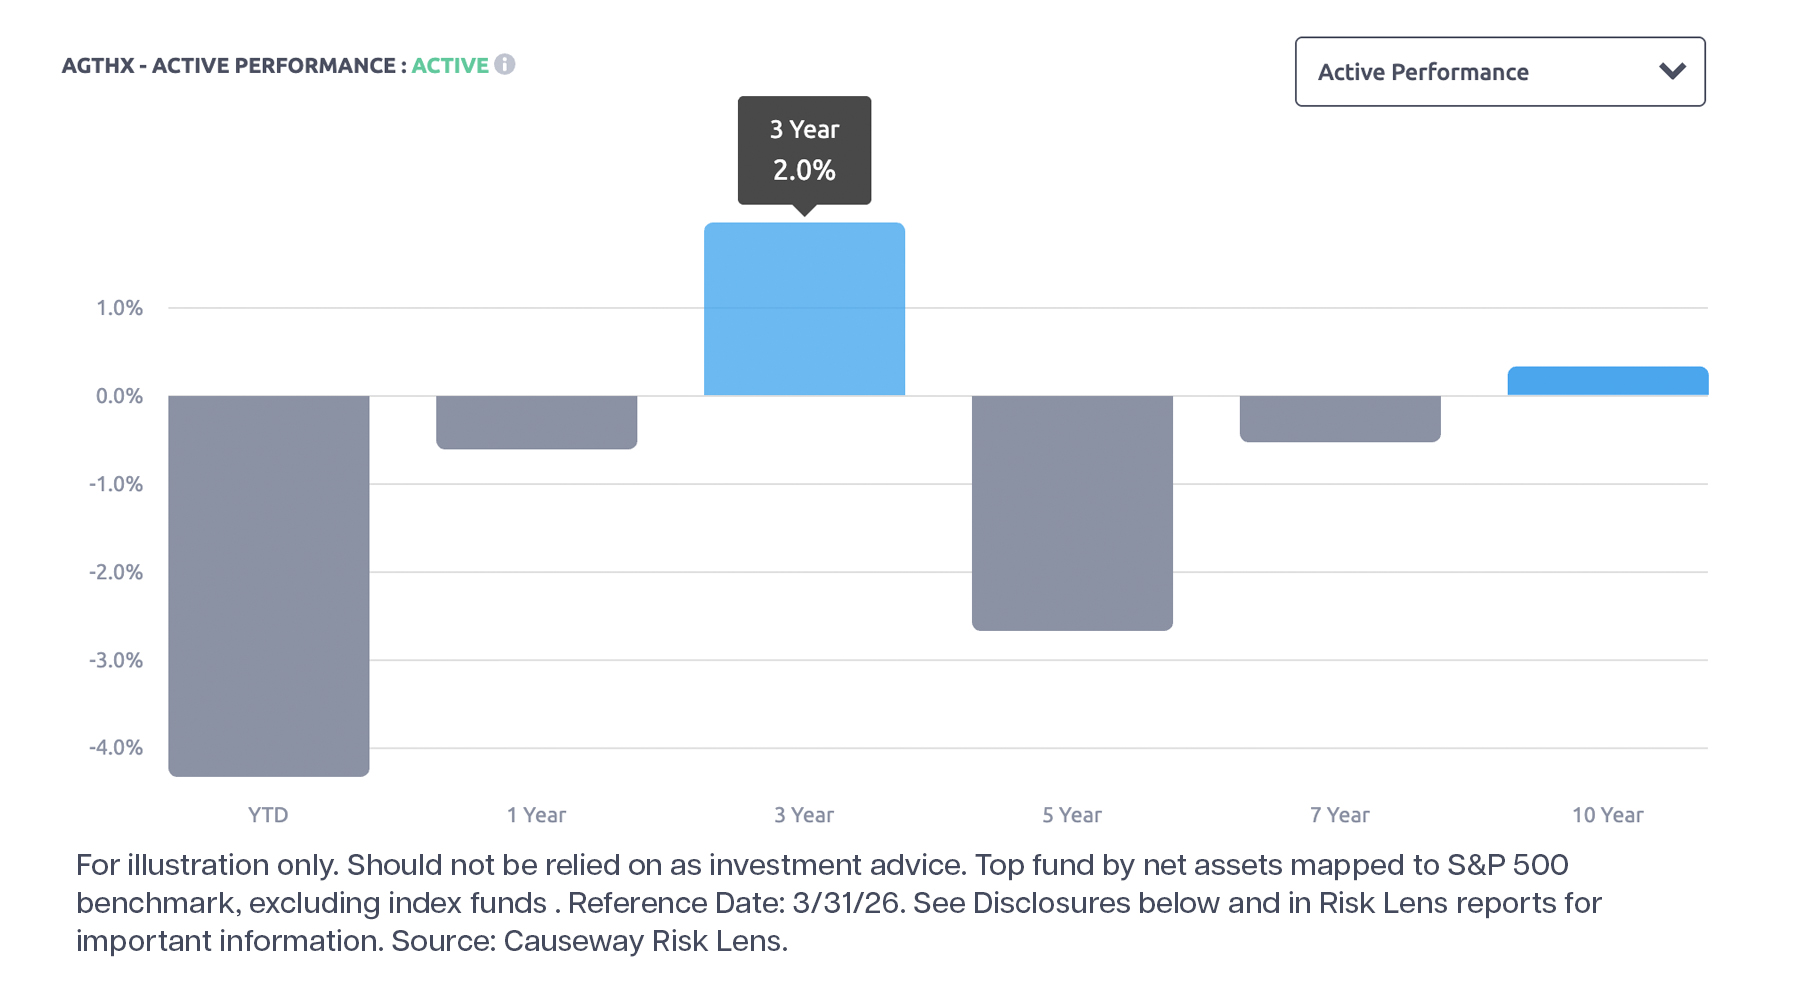
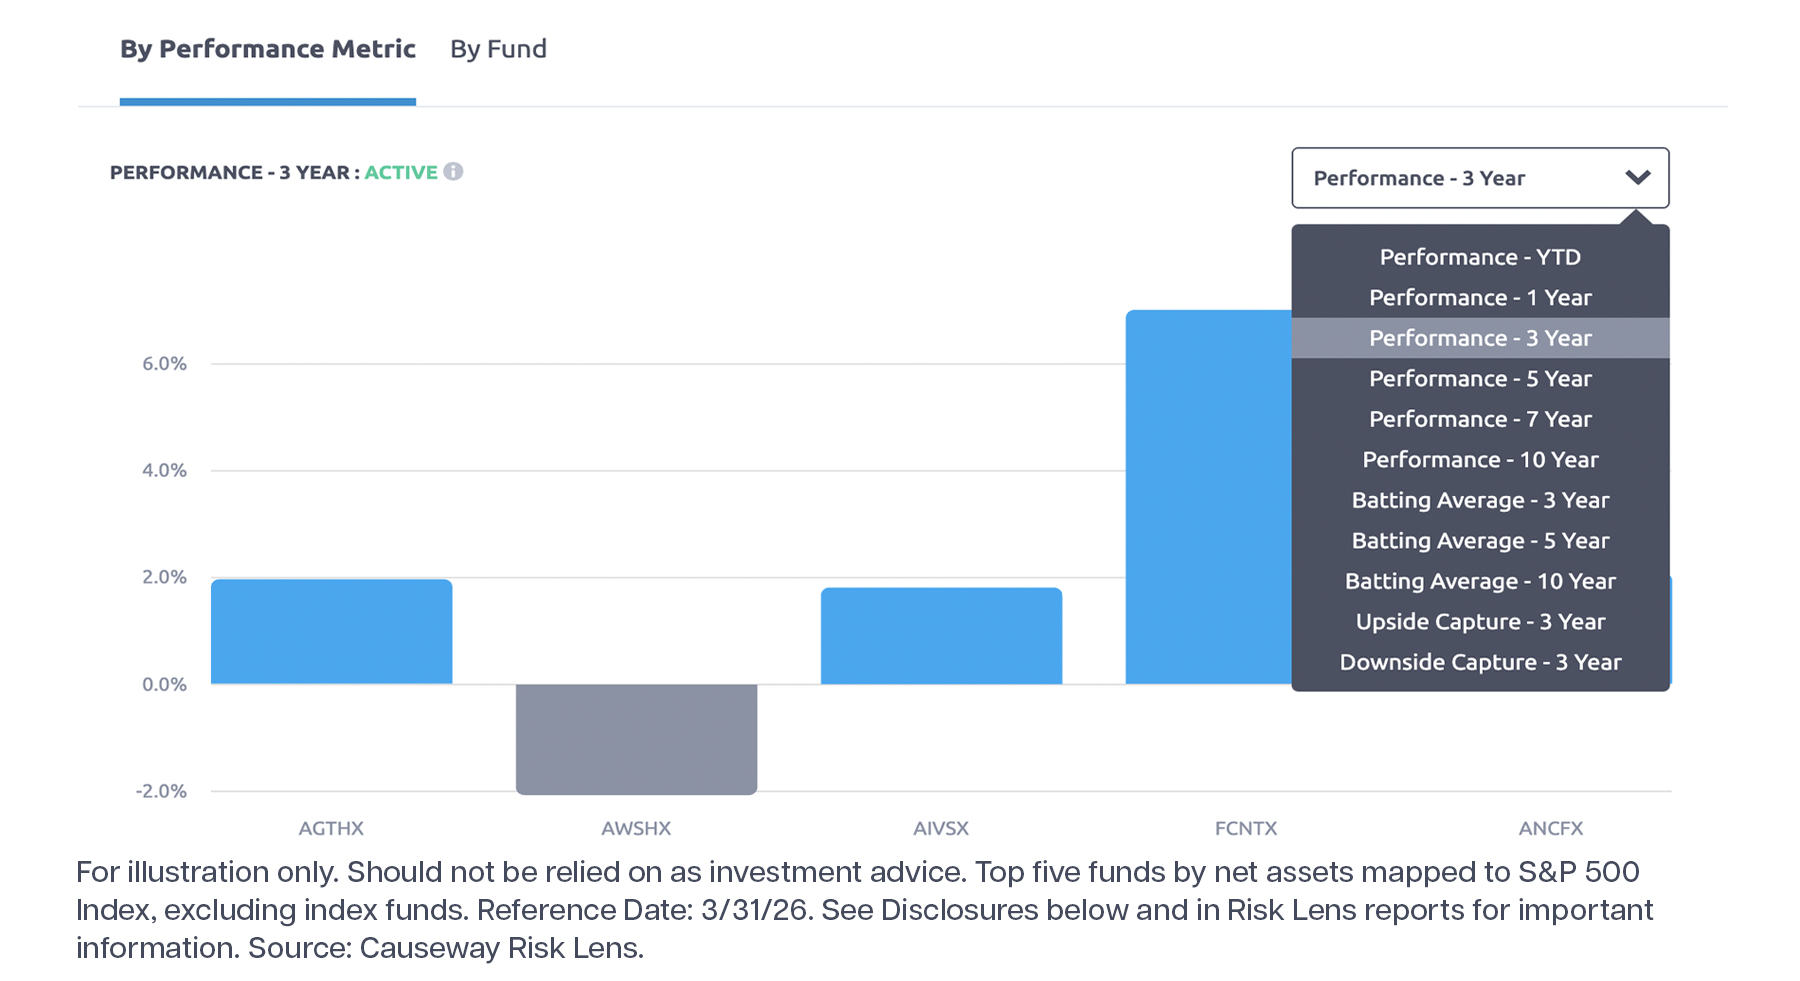
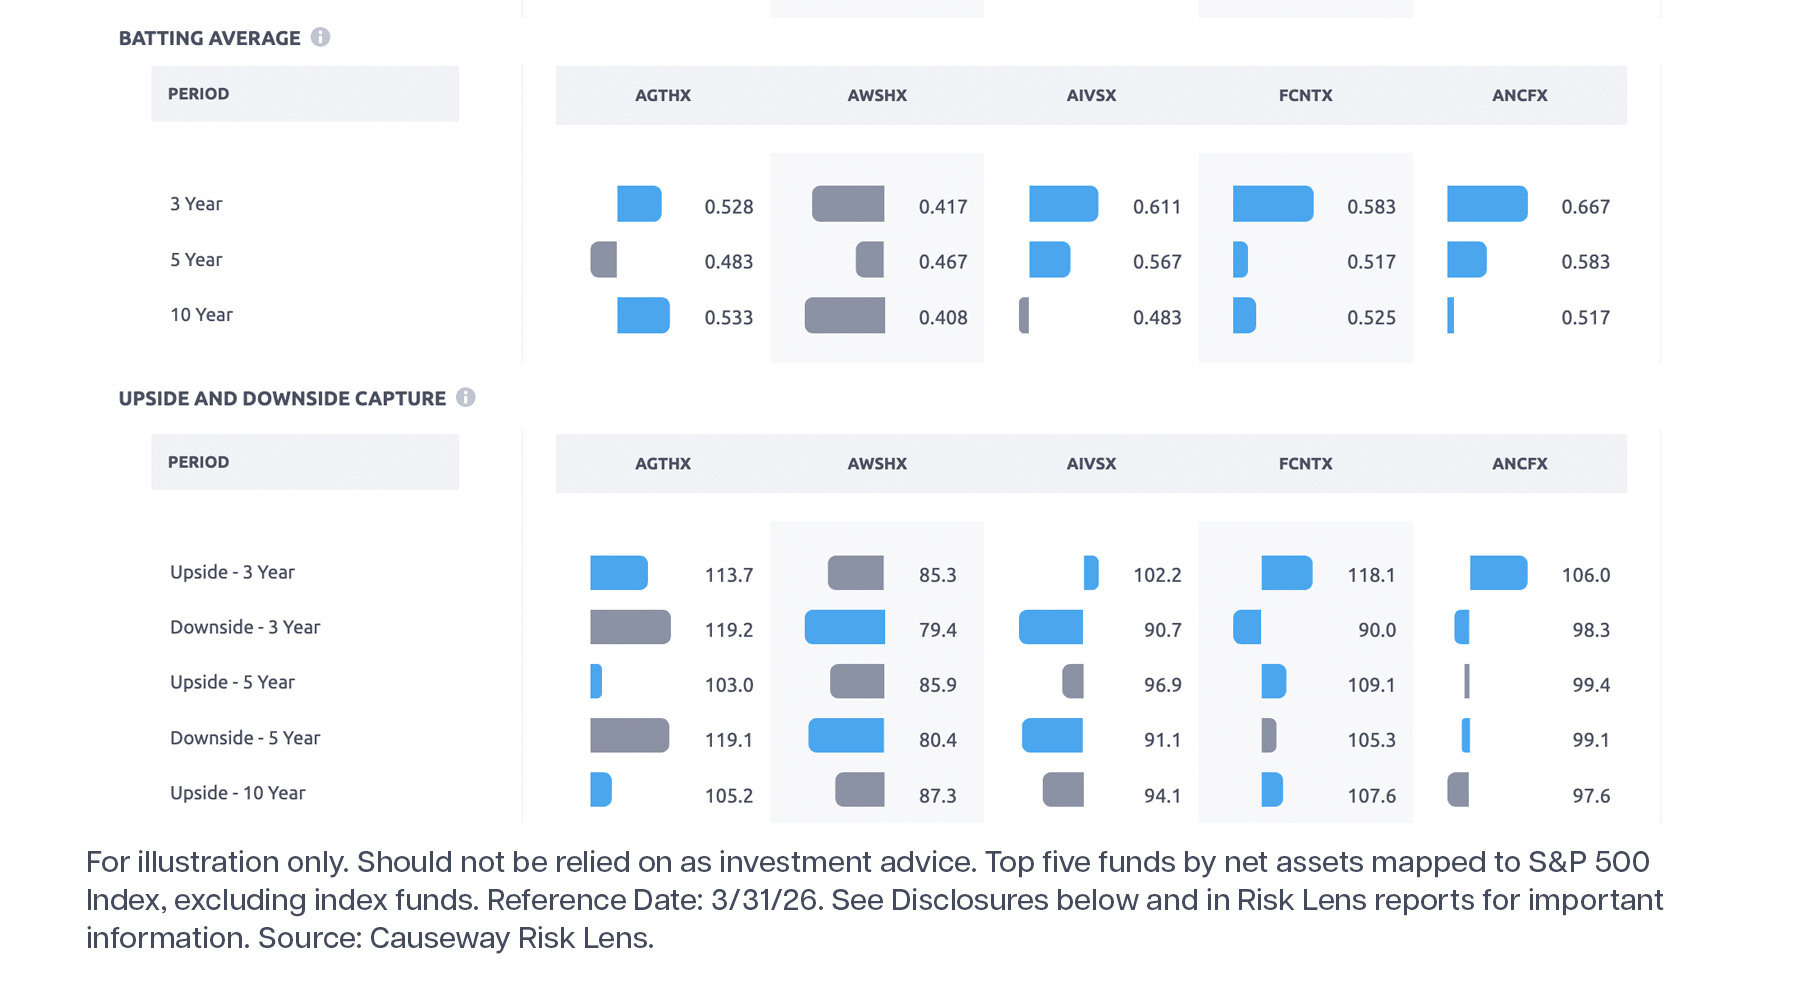
Performance Report compares past active performance, batting averages, upside/downside capture, and other skill metrics.
FUND SCREENER
Screens managers on RISK and SKILL metrics.
FREE
Access the power of Risk Lens at no cost.
Client testimonials
What’s New
Risk Metrics that Matter, May 2026
Risk Lens: Is Your Manager Phoning It In?, March 2026
Who Beat The S&P 500 Index?, November 2025
Donuts Are Good For You: Q&A with Portfolio Manager Joe Gubler, August 2025
Best Performing US Large Cap Growth Funds At June 30, July 2025